The Plot object is new in ATPDraw v7.1. It enables direct, embedded plotting and storage of data. So far only NEWPL4=0/2 is supported. It is particularly useful for documentation purposes and it has some features related to multiple-runs that external plotting programs lack.
The Plot object will automatically update itself after a simulation. Fig. 1 shown a typical Plot object.
New Plots are drawn via the Tools|Drawing tools menu (or Selection menu|Add objects).
Compared to other ATPDraw objects, the Plot object responds somewhat differently to mouse clicks.
Left mouse-clicks are captured by the Plot-object and are used for zooming/panning the plot. However, the user can click outside on the right side handle area to select the object for move and re-size it.
Left double-click opens the Plot Dialog as shown in Fig. 2 for selection of the variables to plot, together with some other settings.
Right-click opens the context menu shown in Fig. 1. This has options for selecting the plot object for move and re-size, hiding in, enable the cursor, copy plot to the clipboard in vector wmf or bitmap formats, and open its two dialog windows.
In the Plot dialog, the user first selects the number of traces to plot, then select the plot in the drop-down menu in the grid under Series name. The order of the possible outputs is the same as in the Output Manager (short-cut F9). The user should first make sure that the node names are updated by selecting ATP|Sub-process/Make node names. Furthermore, only select plots based on user-specified node names (since ATPDraw-generated node names (XXnnnn or Xnnnn) may vary).
The color is chosen in the Series color column and appears as the standard Windows color. By selecting Custom the full range of colors can be selected.
Run is used for multiple run cases (the same variable can be selected for various runs), Scale (*), Offset (+) and Skew (time shift) are optional. Click the Right checkbox to align the plot with the right axis.
Save plots in project offers three options;
•Plot definitions: only store the data in the Plots page (subscribed series/plots).
•+chart settings: store also the chart Settings (any changes in labels, legend, colors, axis, zoom, includes advanced settings).
•+data values: store also the numerical data. In this case the plot shows when opening the project (no need to re-run), but it will also increase the size of the project file. The number of bytes stored is (NumPlots+1)*4*NumSamples (data stored as singles as in pl4), but as ATPDraw compresses the project file it is smaller than the pl4-file.
Draw reduced samples speeds up the drawing process for large number of samples, but sacrifice resolution. GDI+ turns on7off the GDI+ canvas that produce more smooth lines.
On the Settings page shown in Fig. 2b, the user can change the most important axis and panel settings. Zooming is made by left click, hold and drag in the plot, but fine-tuning of the axis in Settings might be needed for documentation purposes. It also enables setting a series on the x-axis, replacing the time.
If necessary, click on the Advanced settings to bring up the 'Chart settings' native (and complex) TChart dialog shown in Fig. 3. This enables settings of many more plot properties, including fonts.
The 'Chart settings' dialog gives the user deep control of the display of the plot including changing axis, and export as shown in Fig. 3. The plotting object is the default TChart component found in Delphi. The standard version does not allow customization/simplification of the 'Chart settings' dialog.
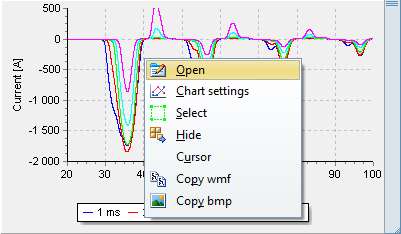
Fig. 1 Right-click context menu.
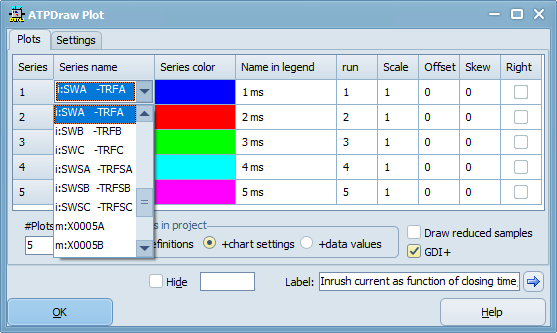
Fig. 2a Open Plot dialog. (Left double-click or Right-click+Open)
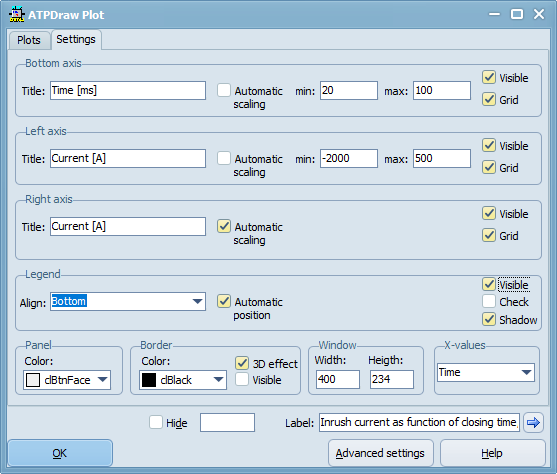
Fig. 2b Open Plot dialog, Settings page.
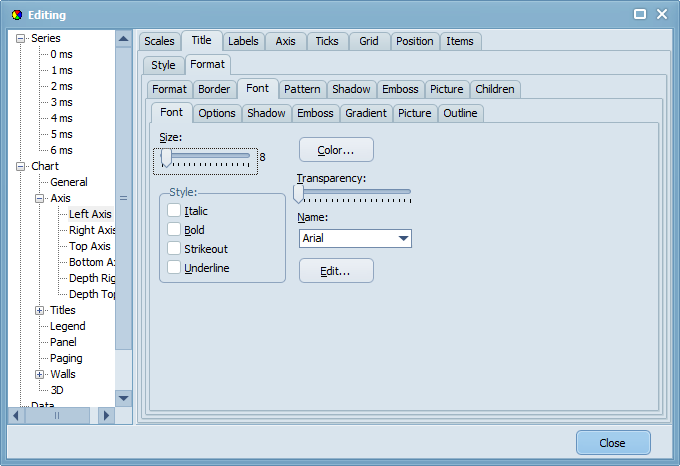
Fig. 3 Advanced Chart Settings.